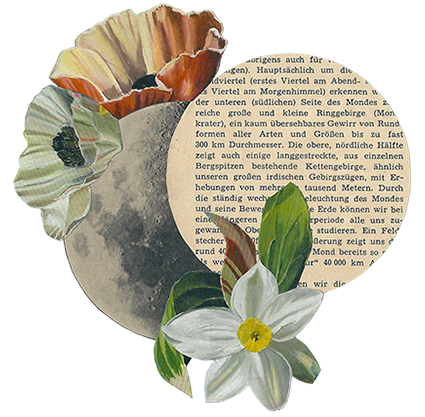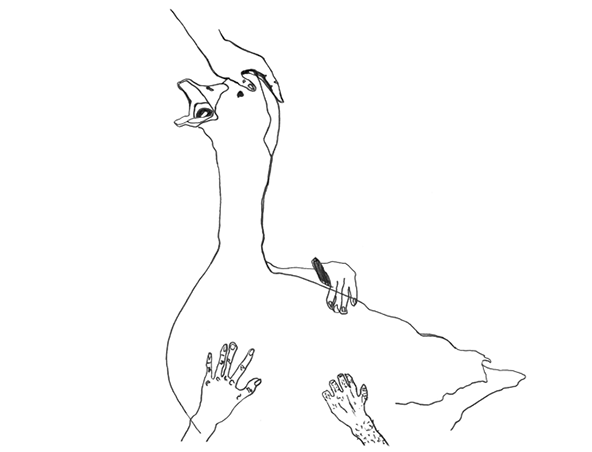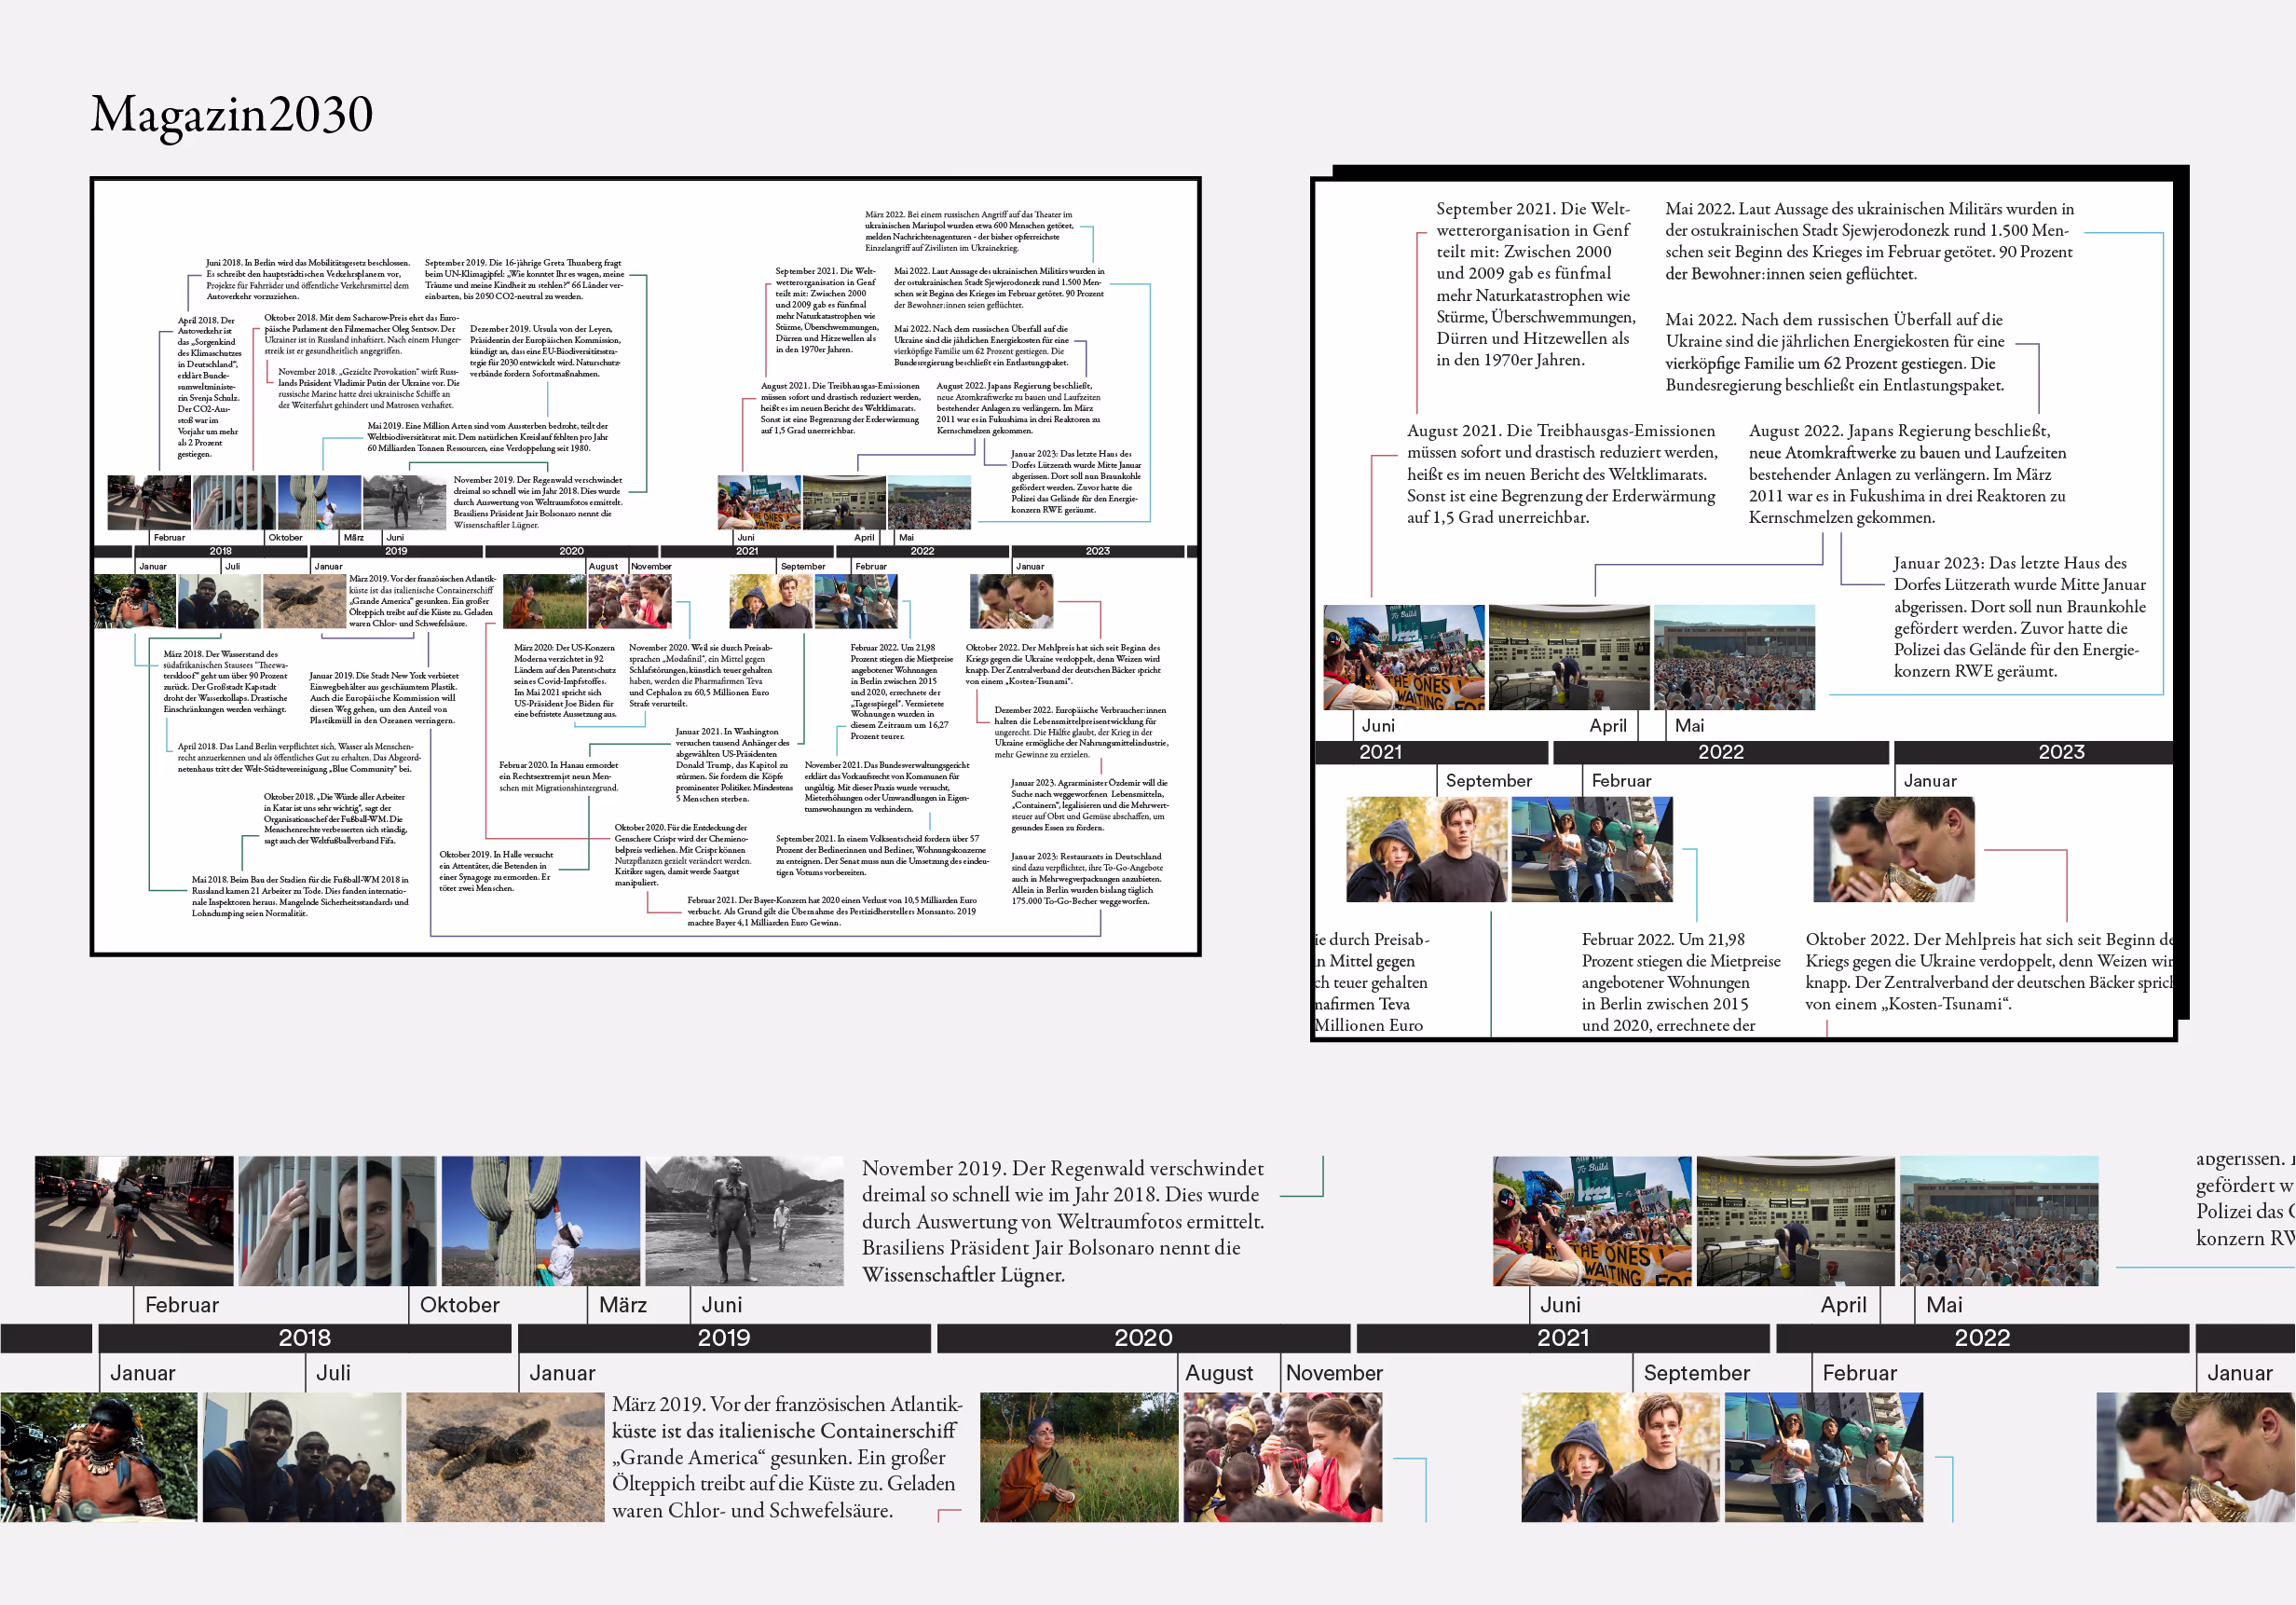
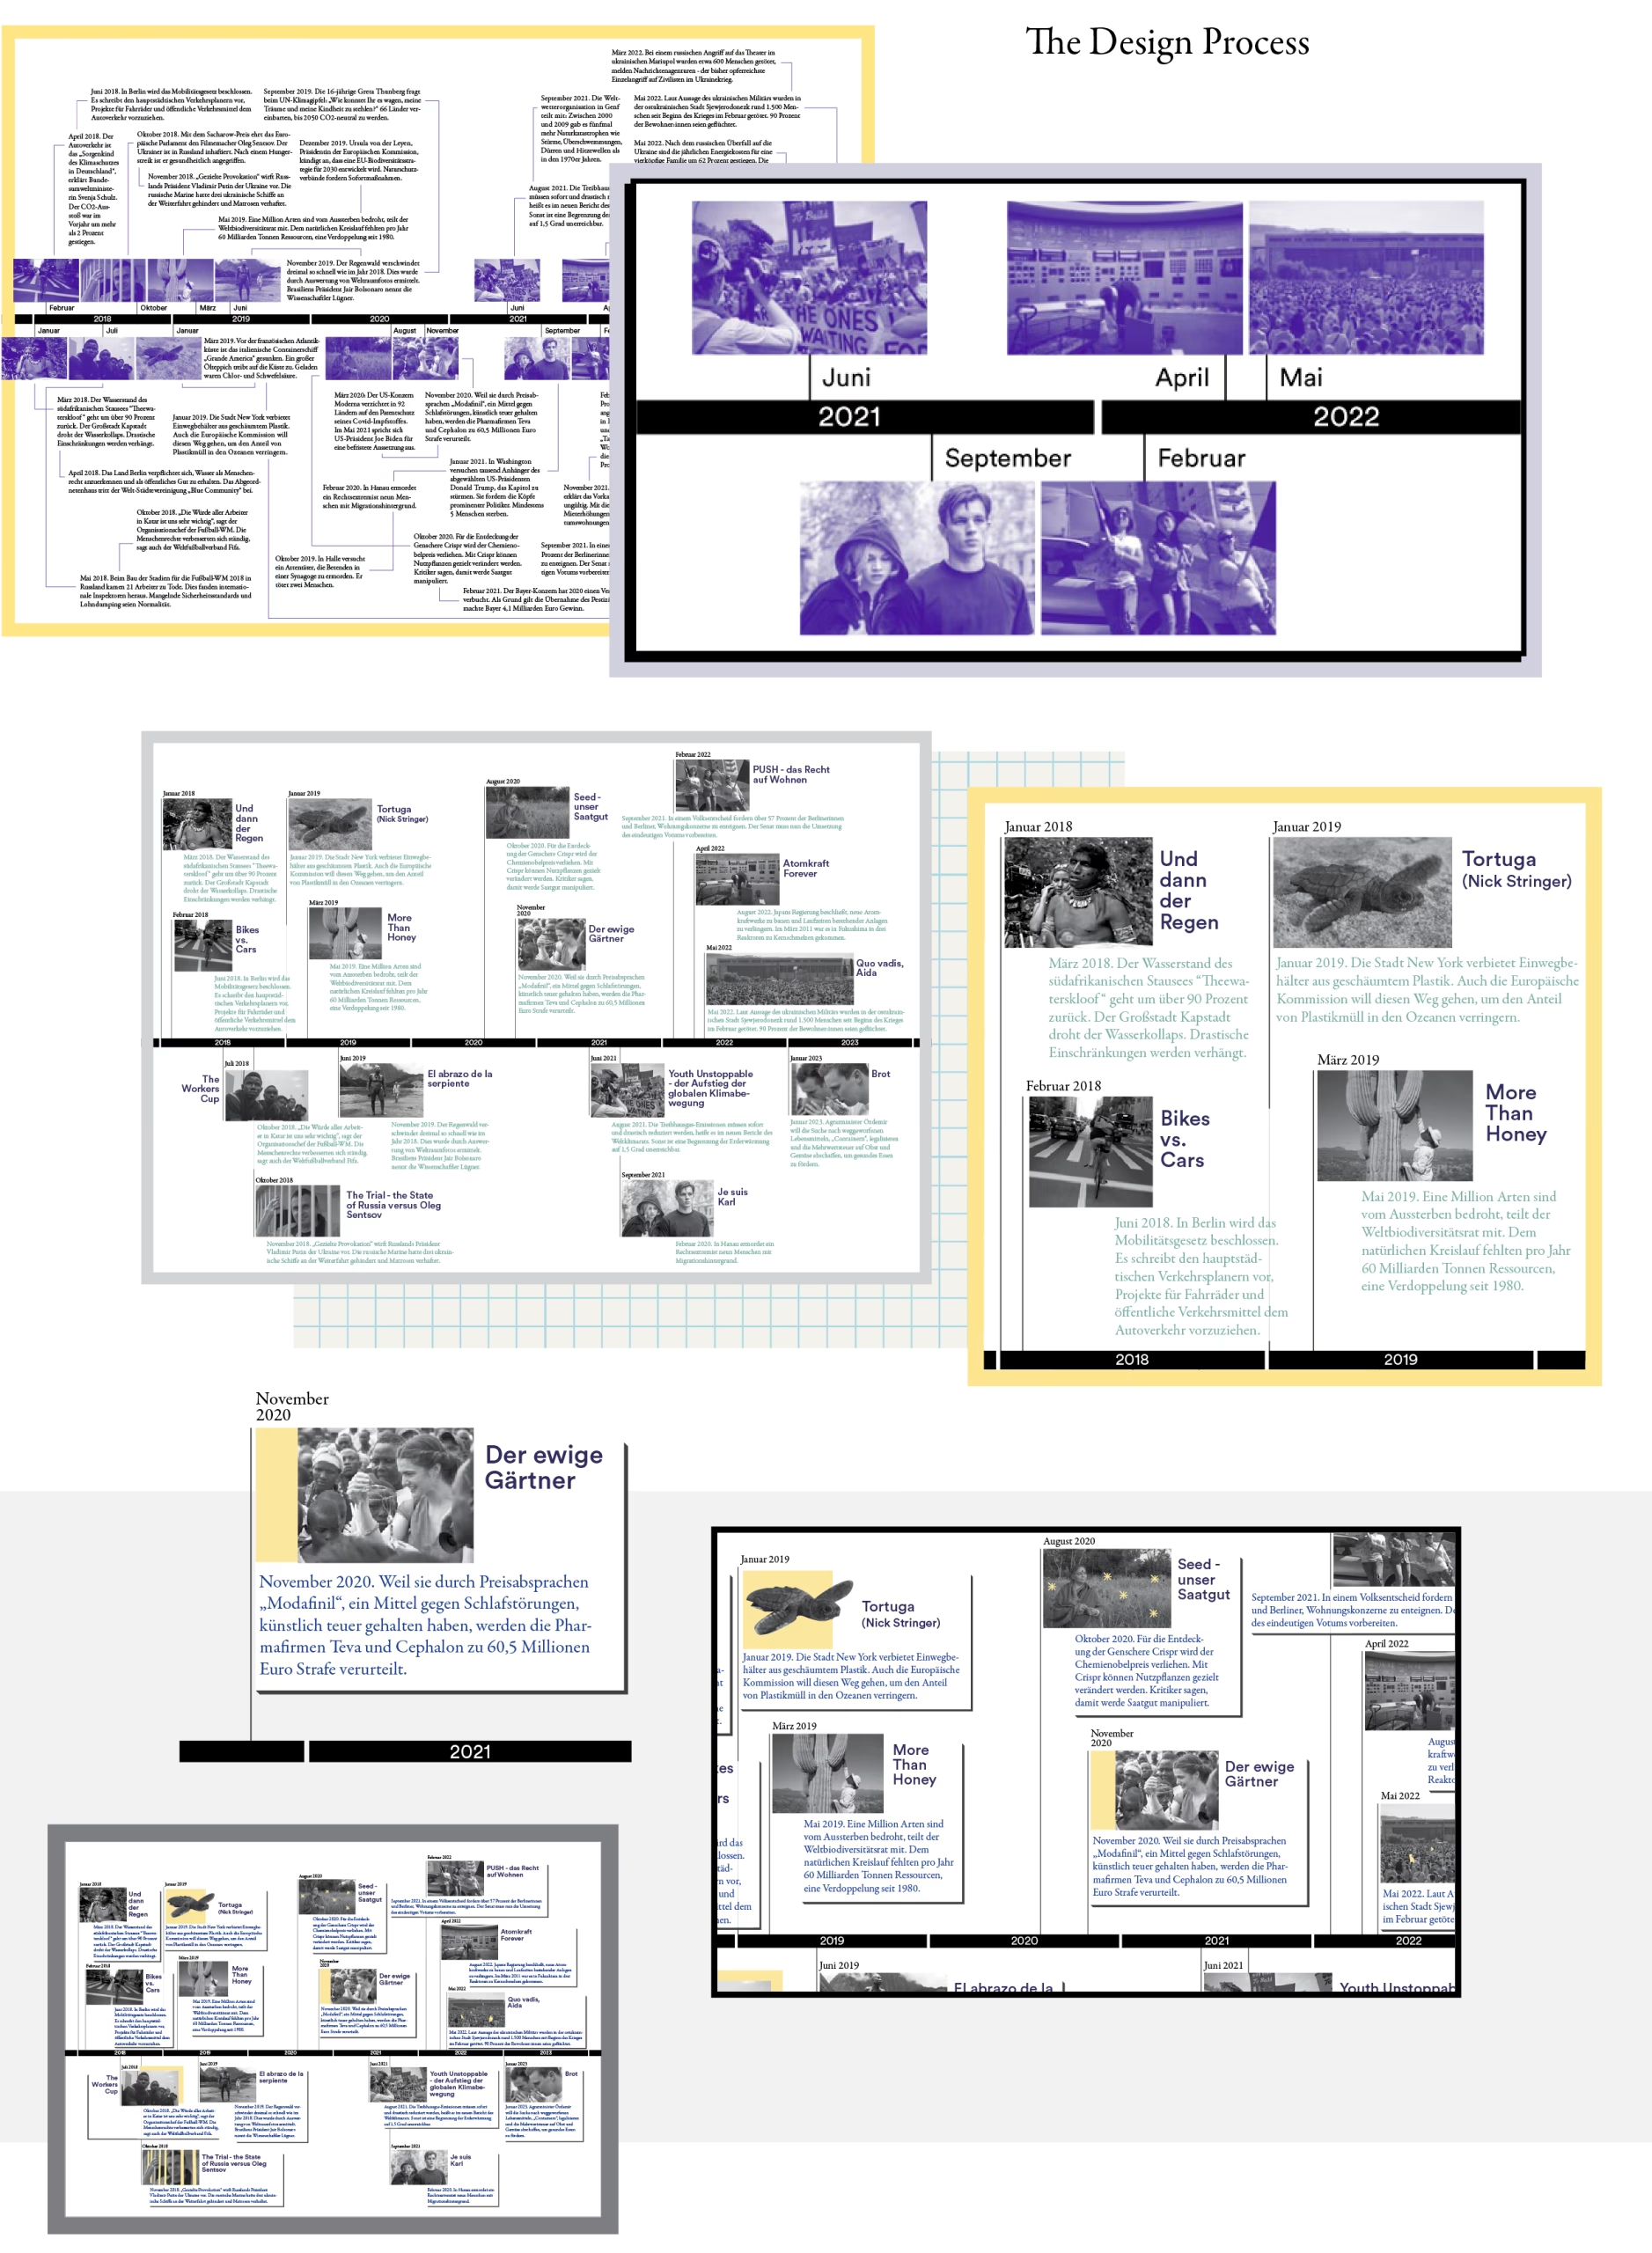
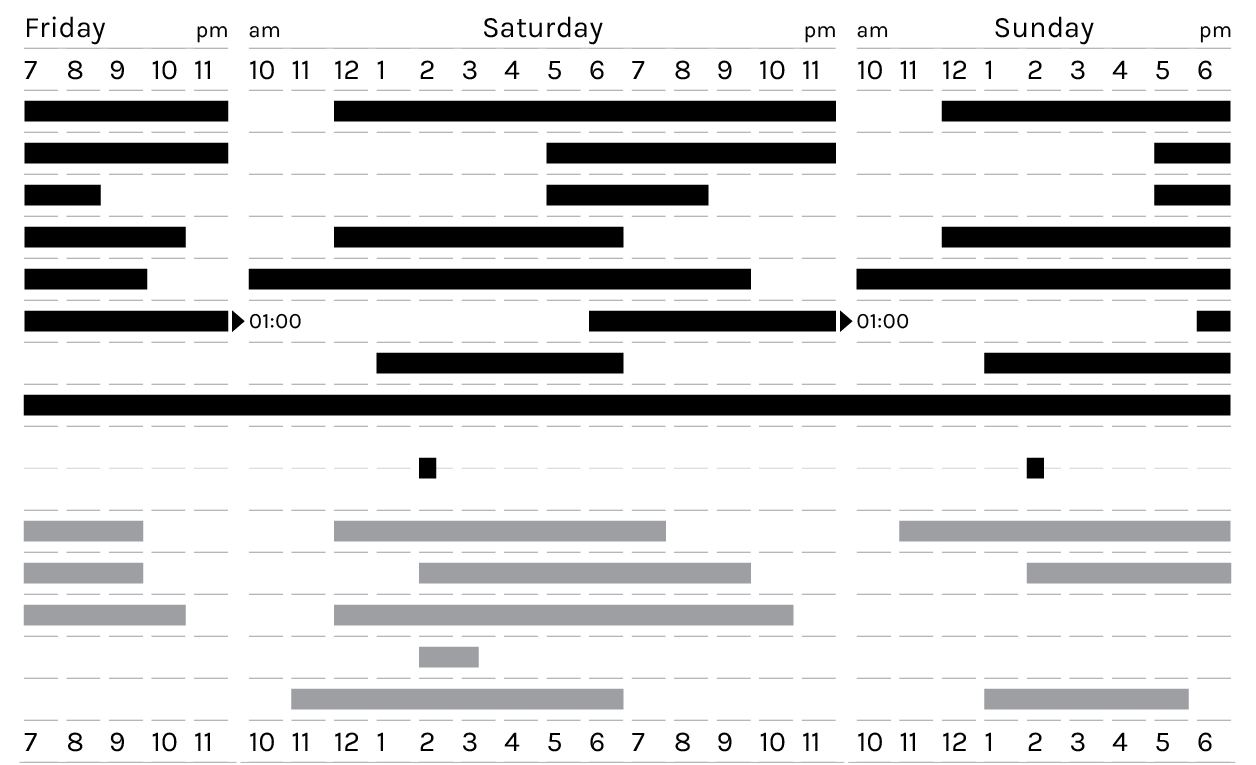
I created this timeline infographic for MGZN2030. It connects a selection of movies with current political events. The magazine I made the graphic for revolves around a Berlin-based film series called Filmreihe #2030. They regularly show movies that are related to the UNDP’s Sustainable Development Goals.
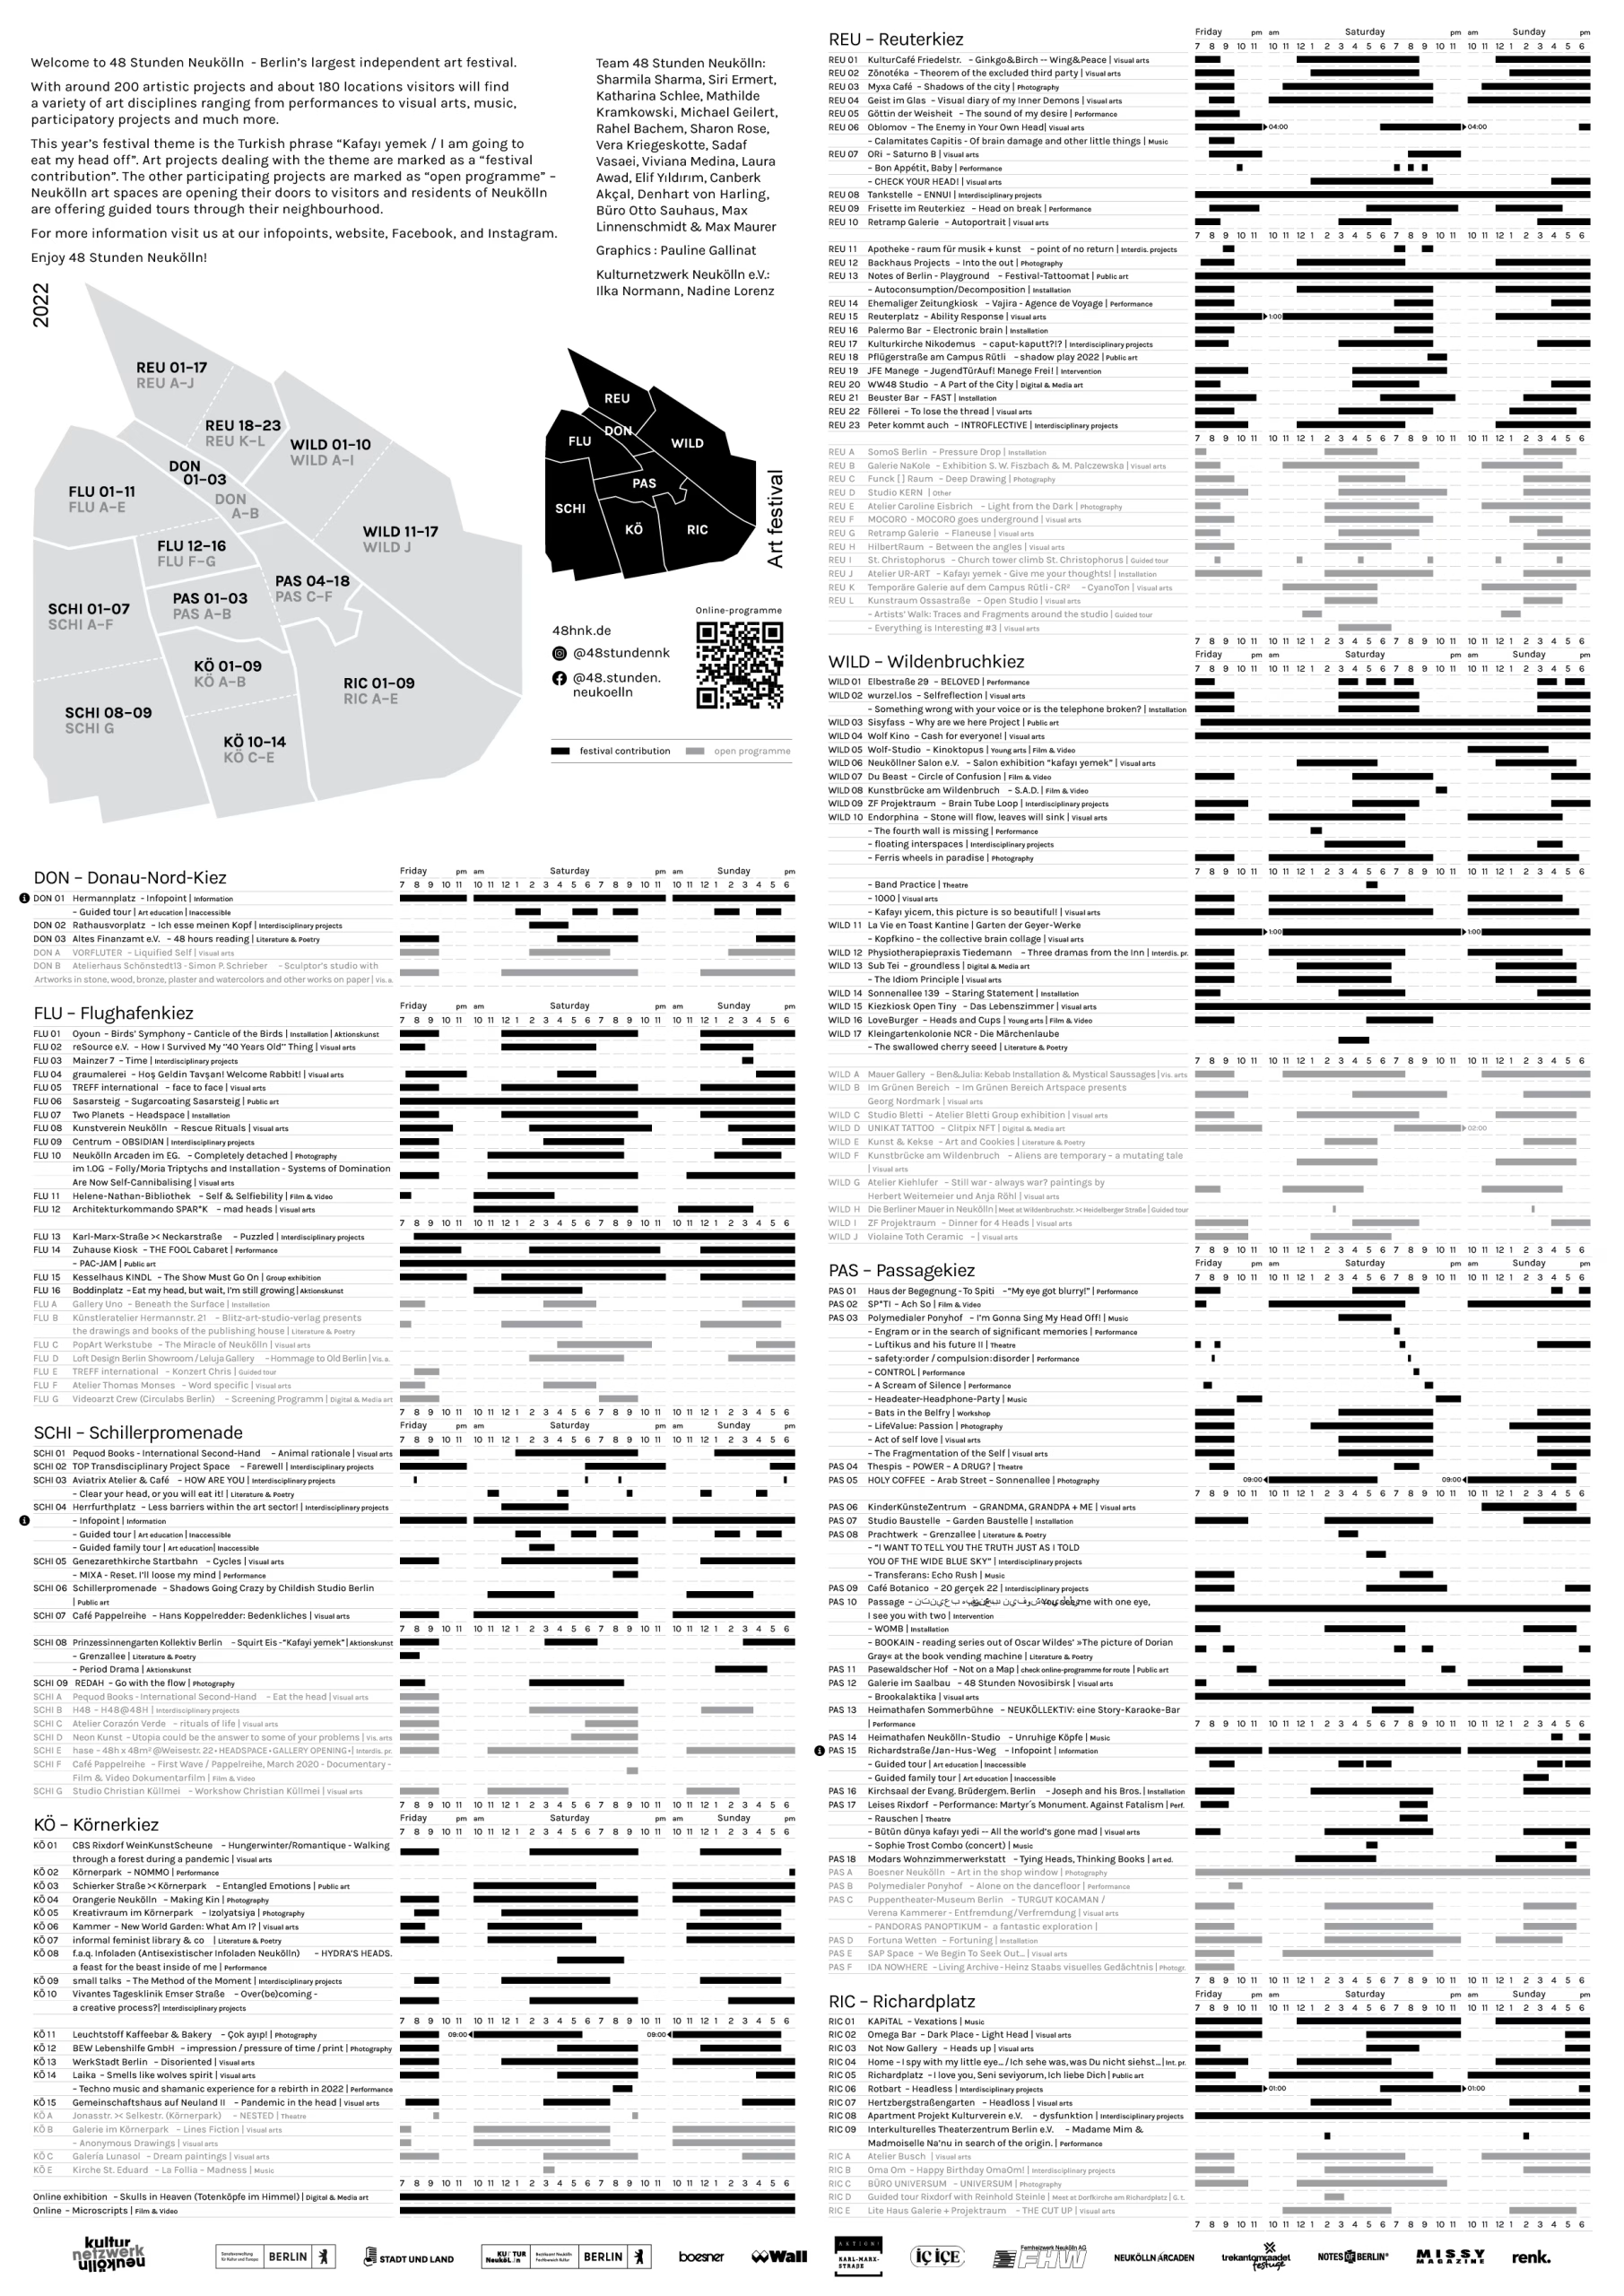
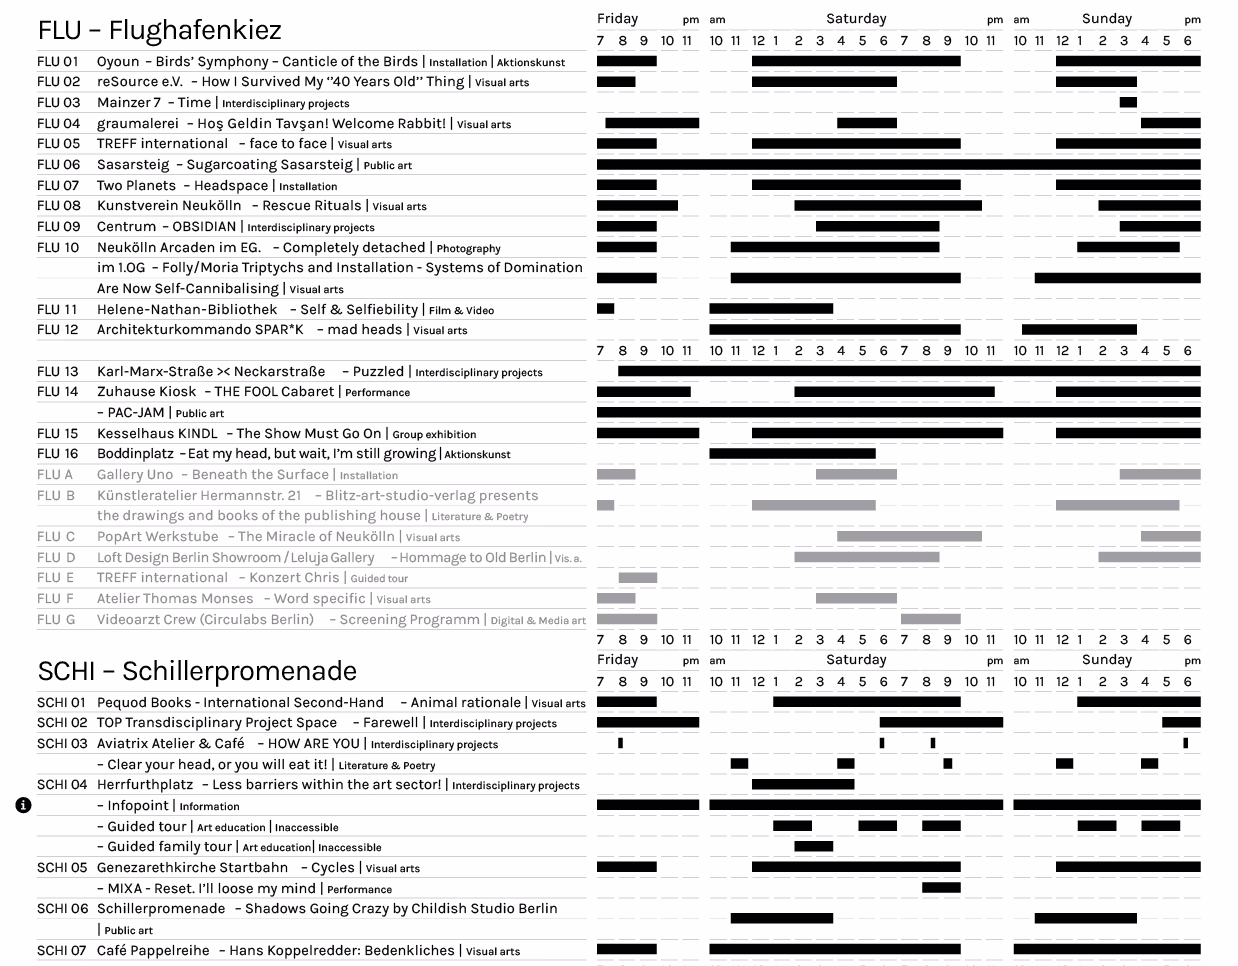
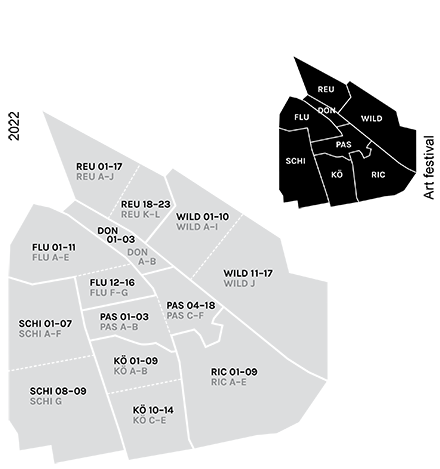
In 2022, I designed the program layout for 48 Stunden Neukölln, Berlin’s largest independent art festival. The program was available both as a printed foldable guide, and as a downloadable PDF from the festival’s website.
The front page featured a comprehensive map highlighting all 180 event locations. The second page provided detailed information about the art program, including a timetable for each art piece.
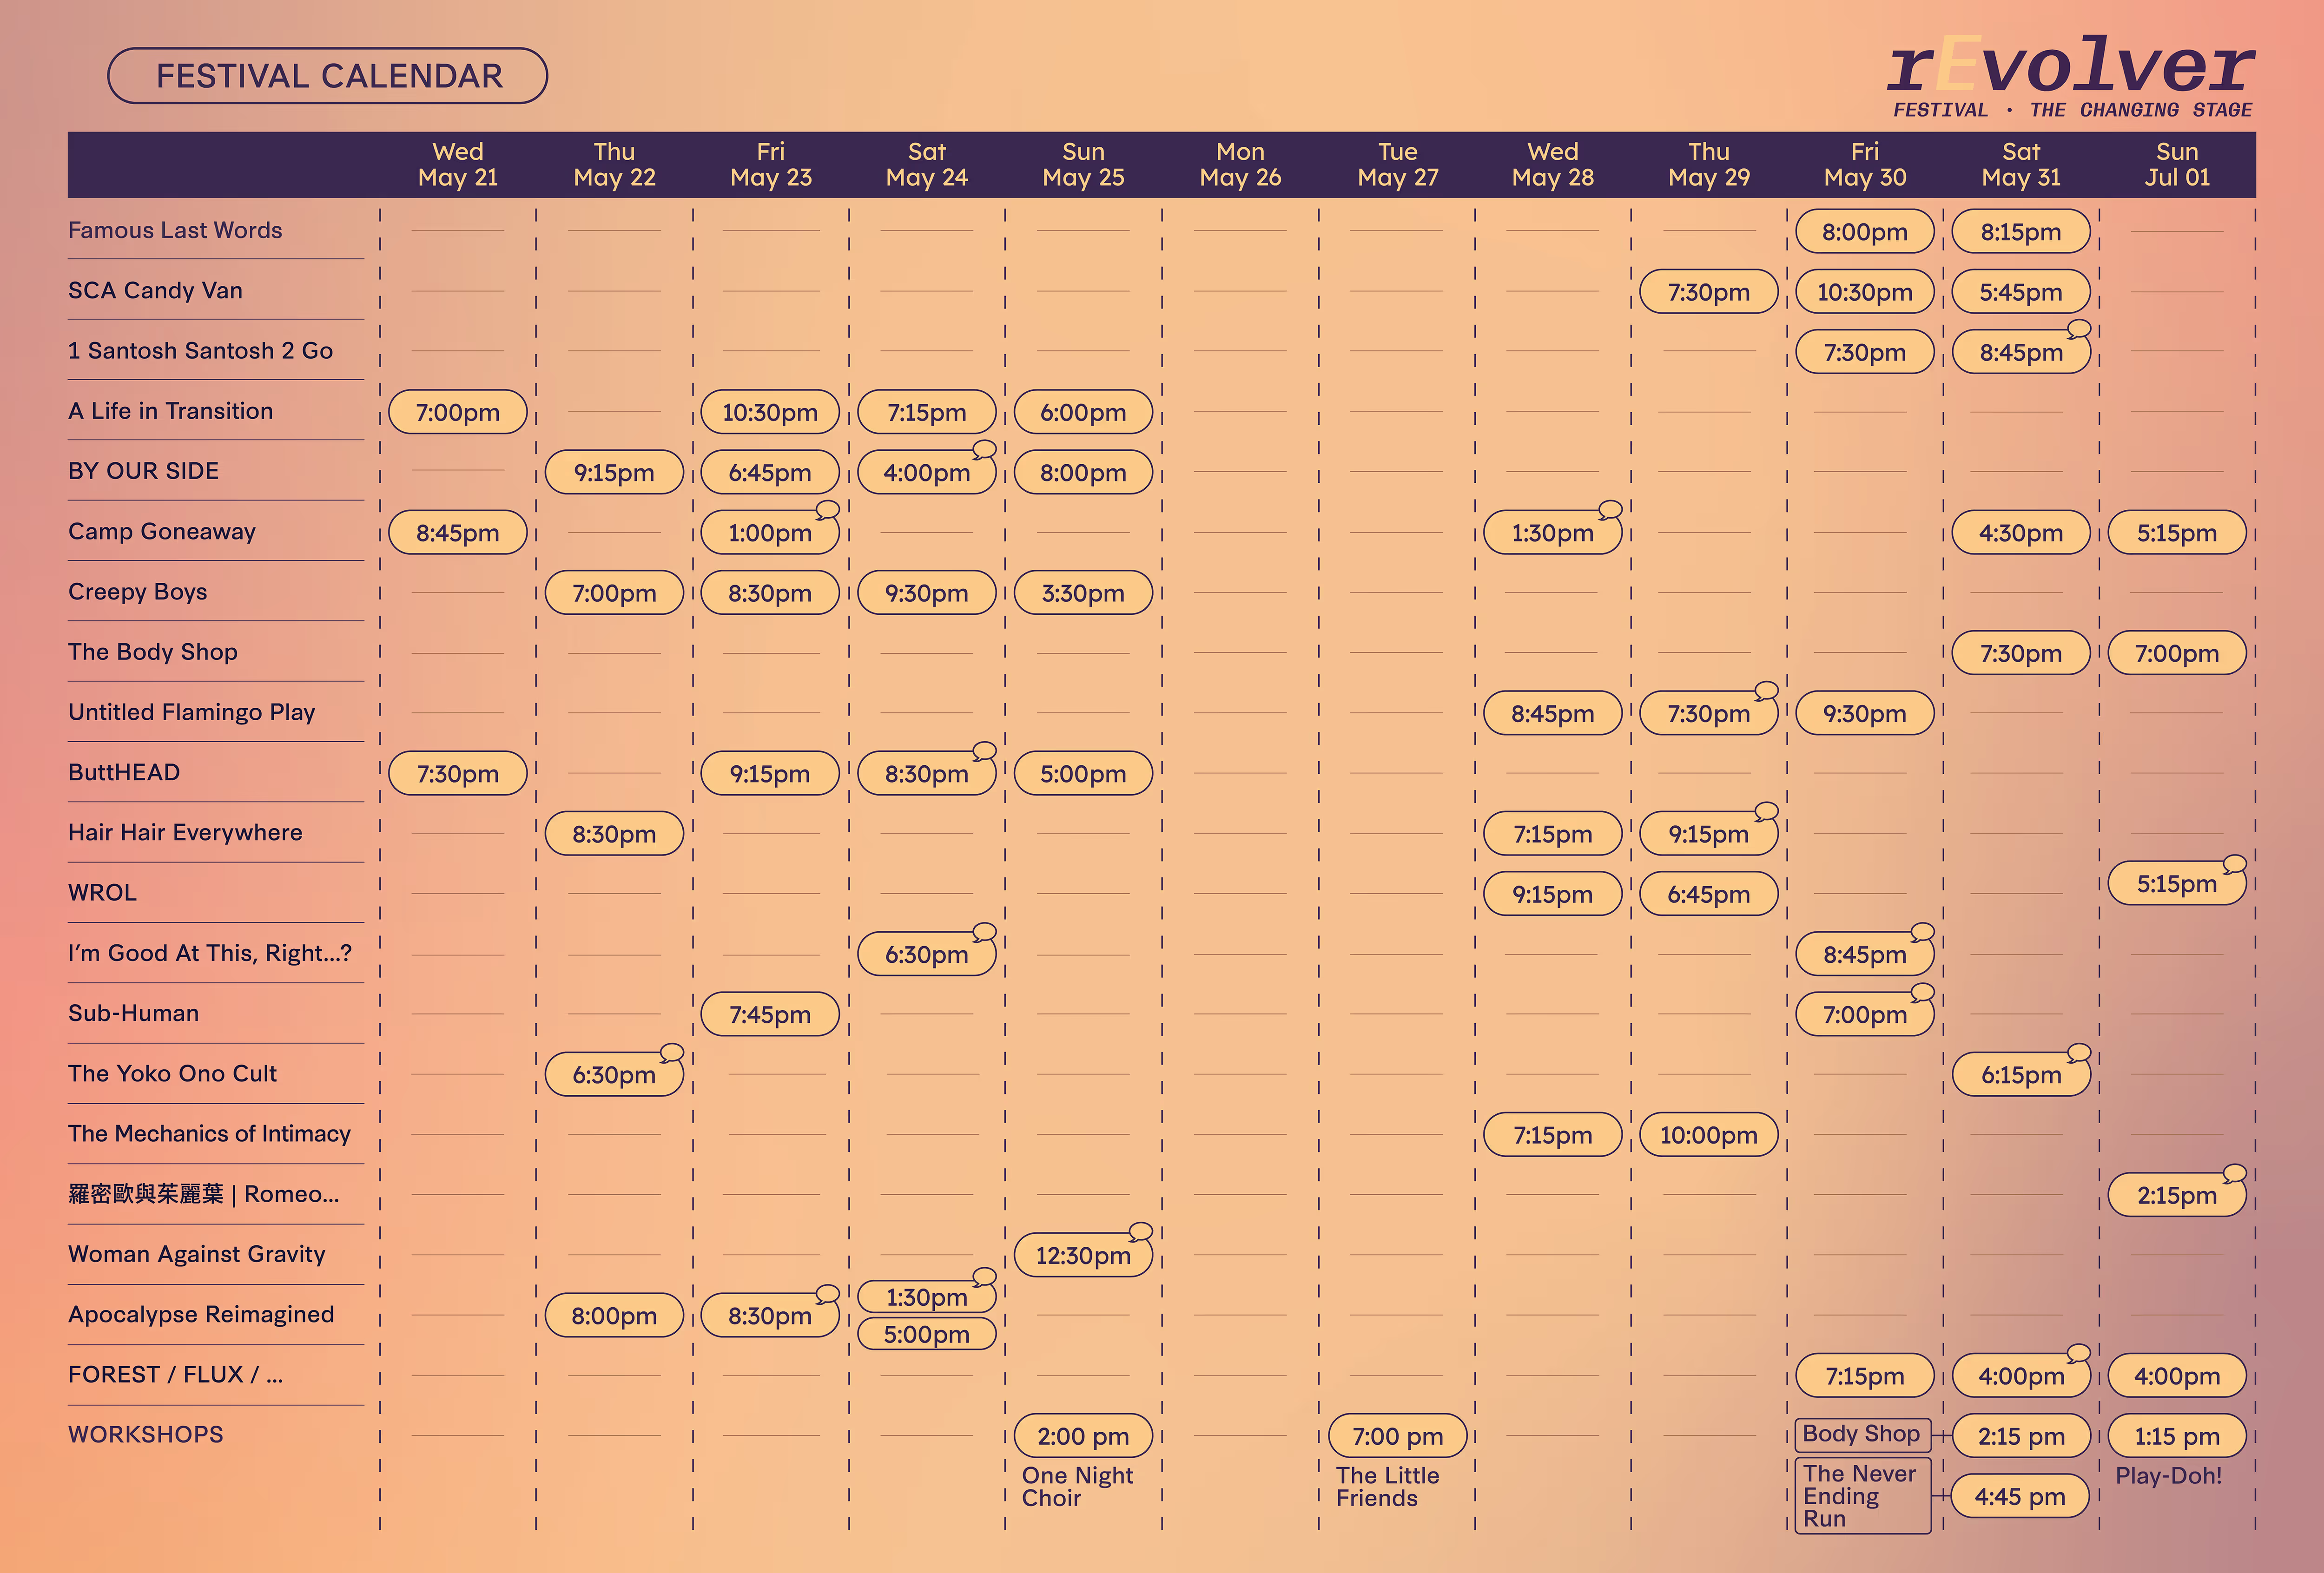
The rEvolver Festival is a multidisciplinary performing arts festival presented by Upintheair Theatre in Vancouver. The festival showcases adventurous new work by emerging and early-mid career artists, spanning theatre, dance, installation, site-specific performance, and experimental forms.
I designed the 2025 festival program guide, bringing together editorial design and event graphics to easily guide audiences through the festival experience. The festival timeline lays out events across dates and venues in a clear visual format through an otherwise rich and multi-layered program.
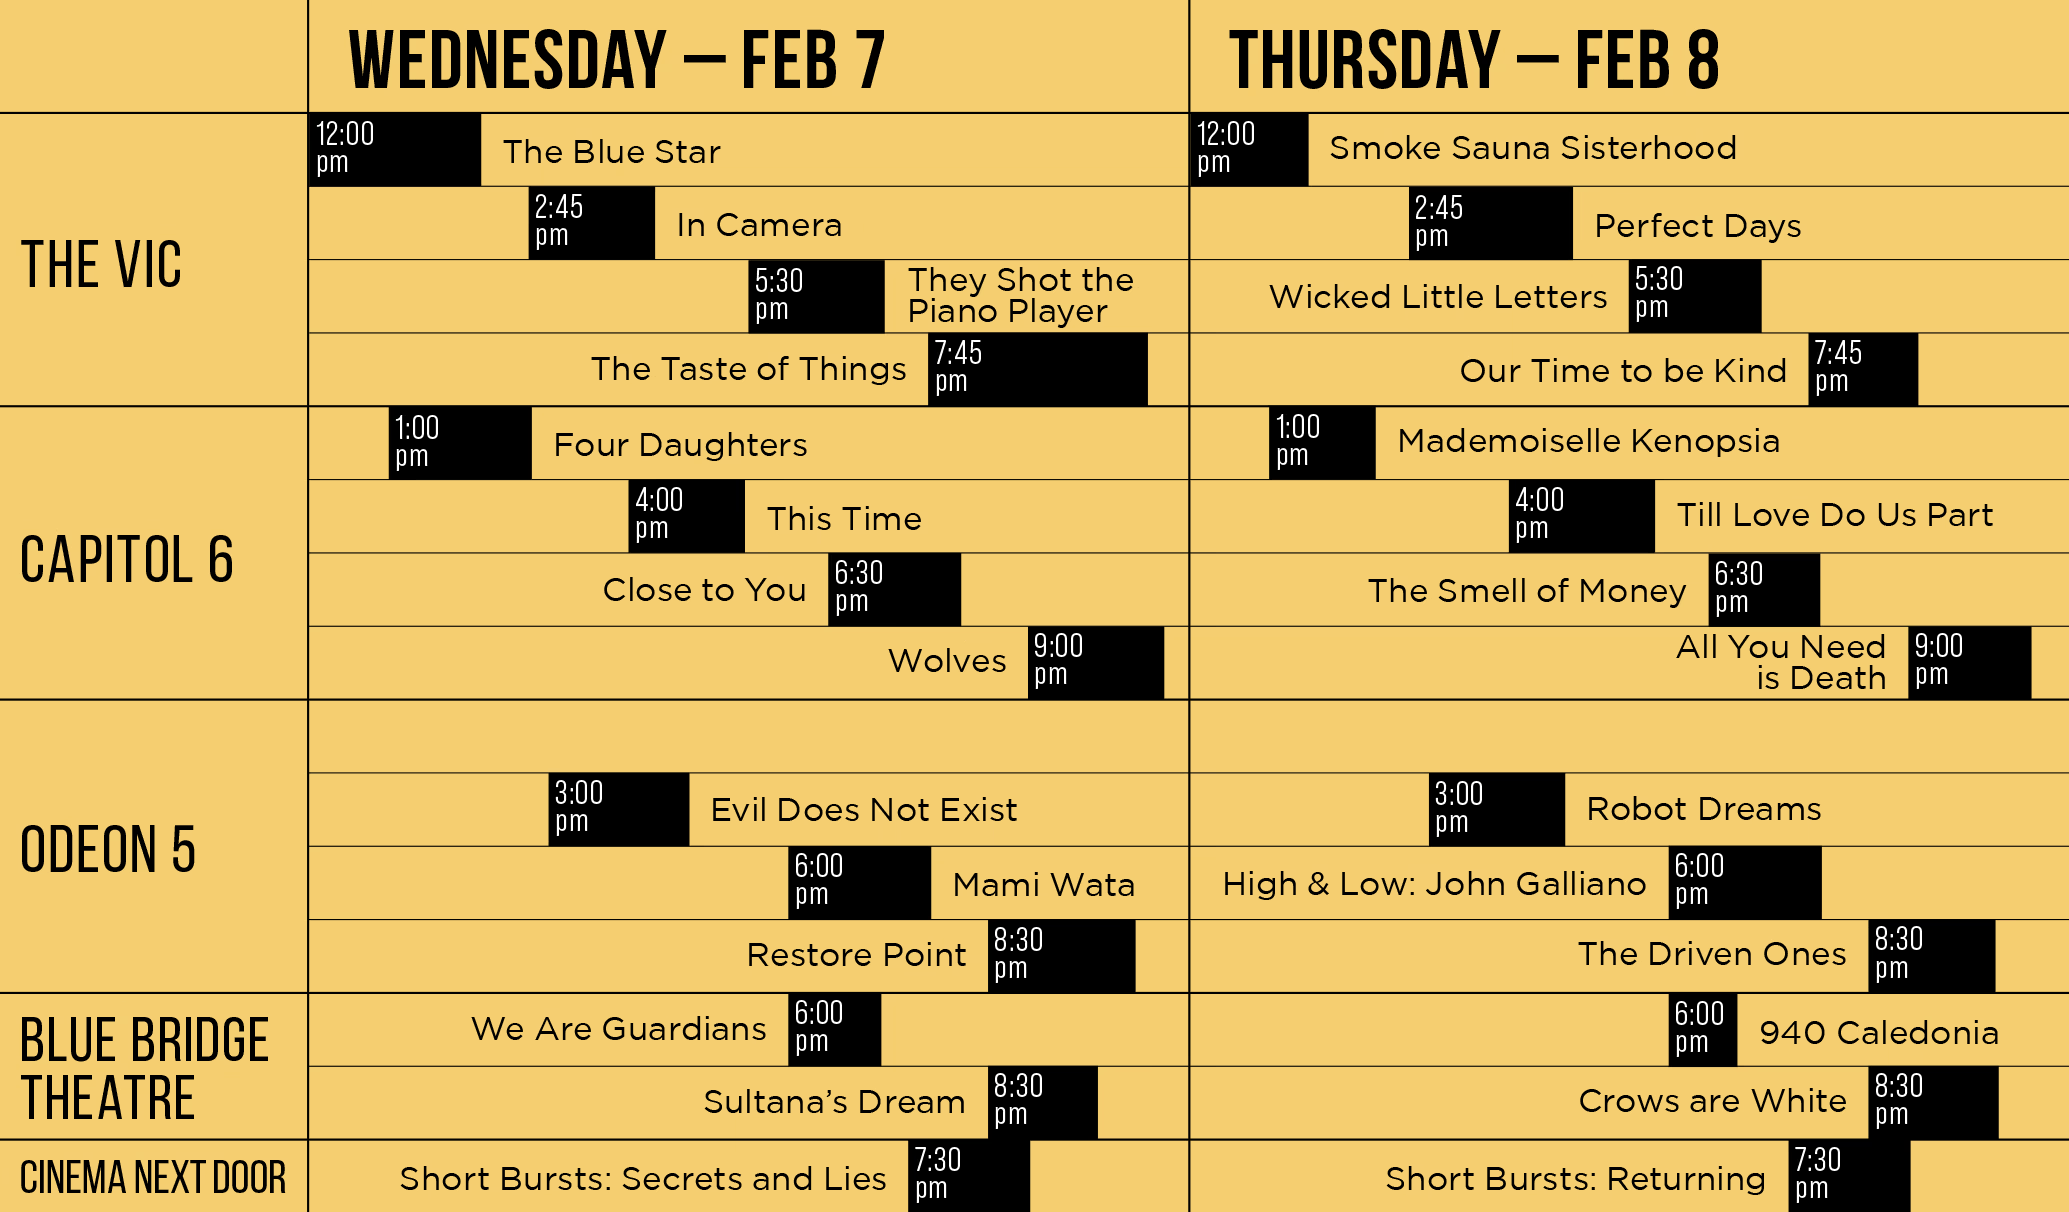
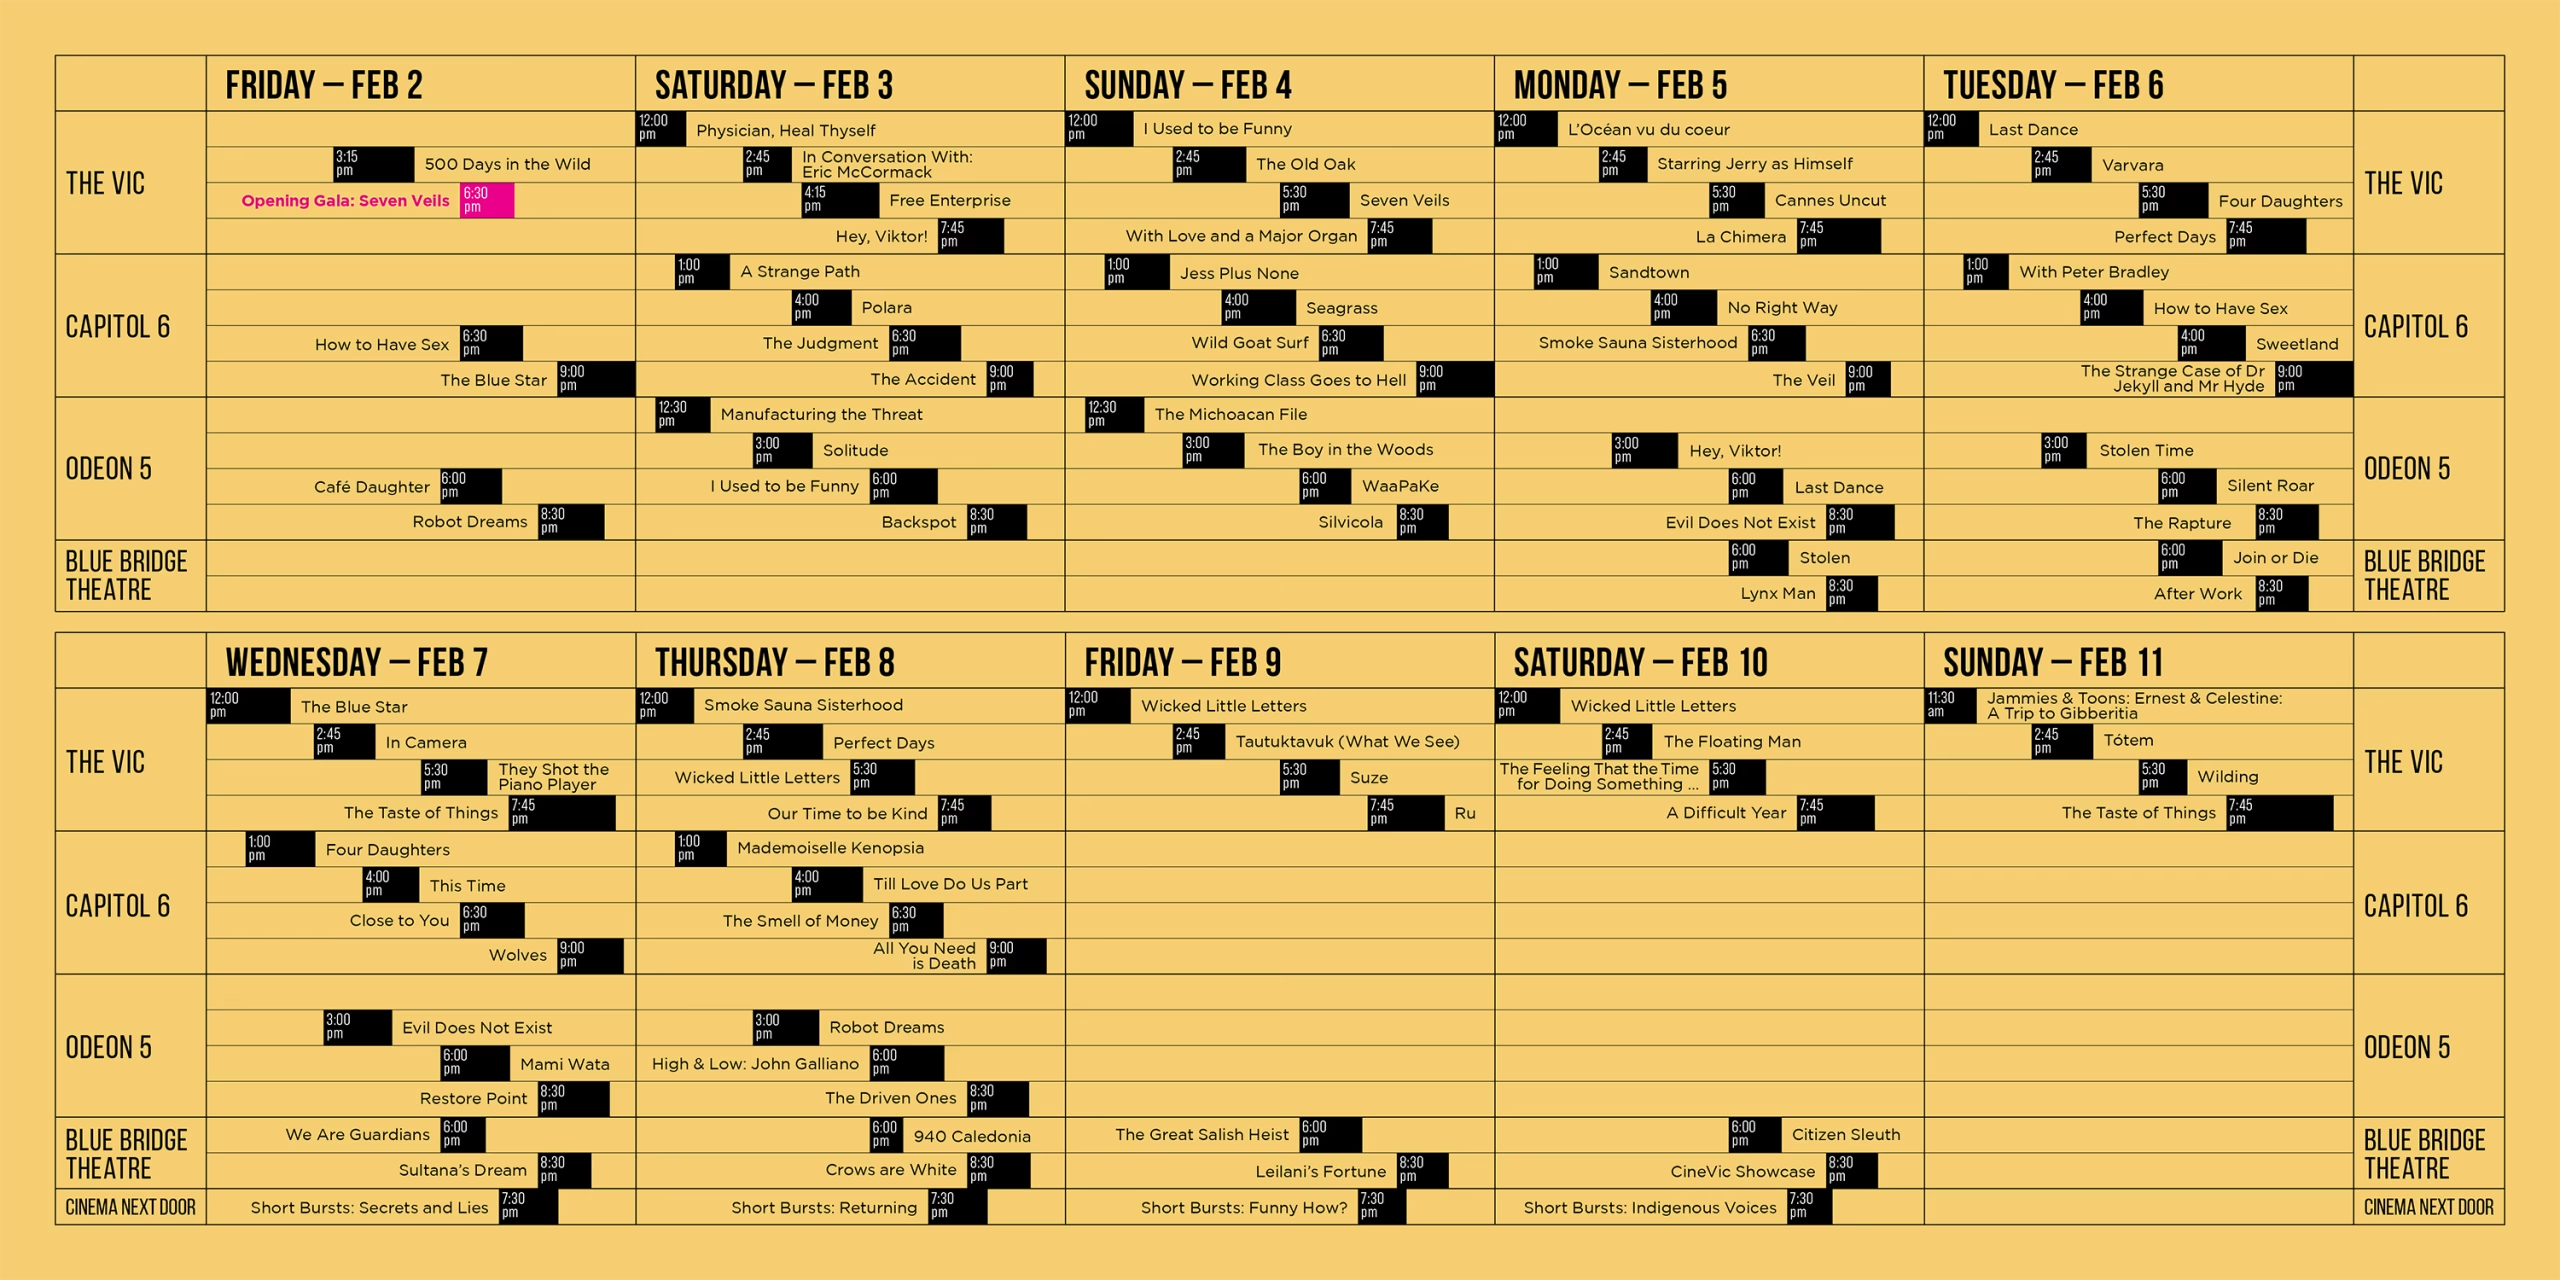
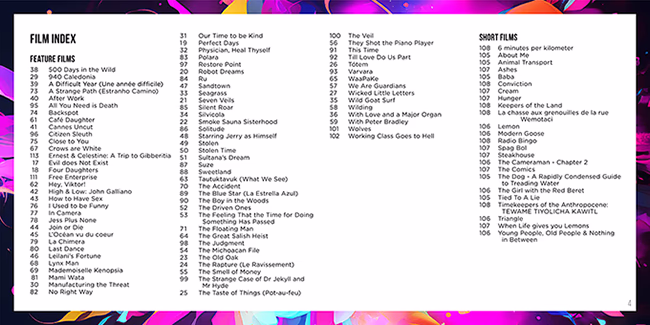
This festival timeline is from the 2024 Victoria Film Festival, for which I designed the festival guide along with a range of other assets across two festival seasons.
In the print version, I included the festival timeline for the first time and created a new layout that allows visitors to see the full screening schedule at a glance, without unfolding the entire flyer. Audiences can easily mark their preferred films and understand potential overlaps, as each screening is visualized in proportion to its actual length.
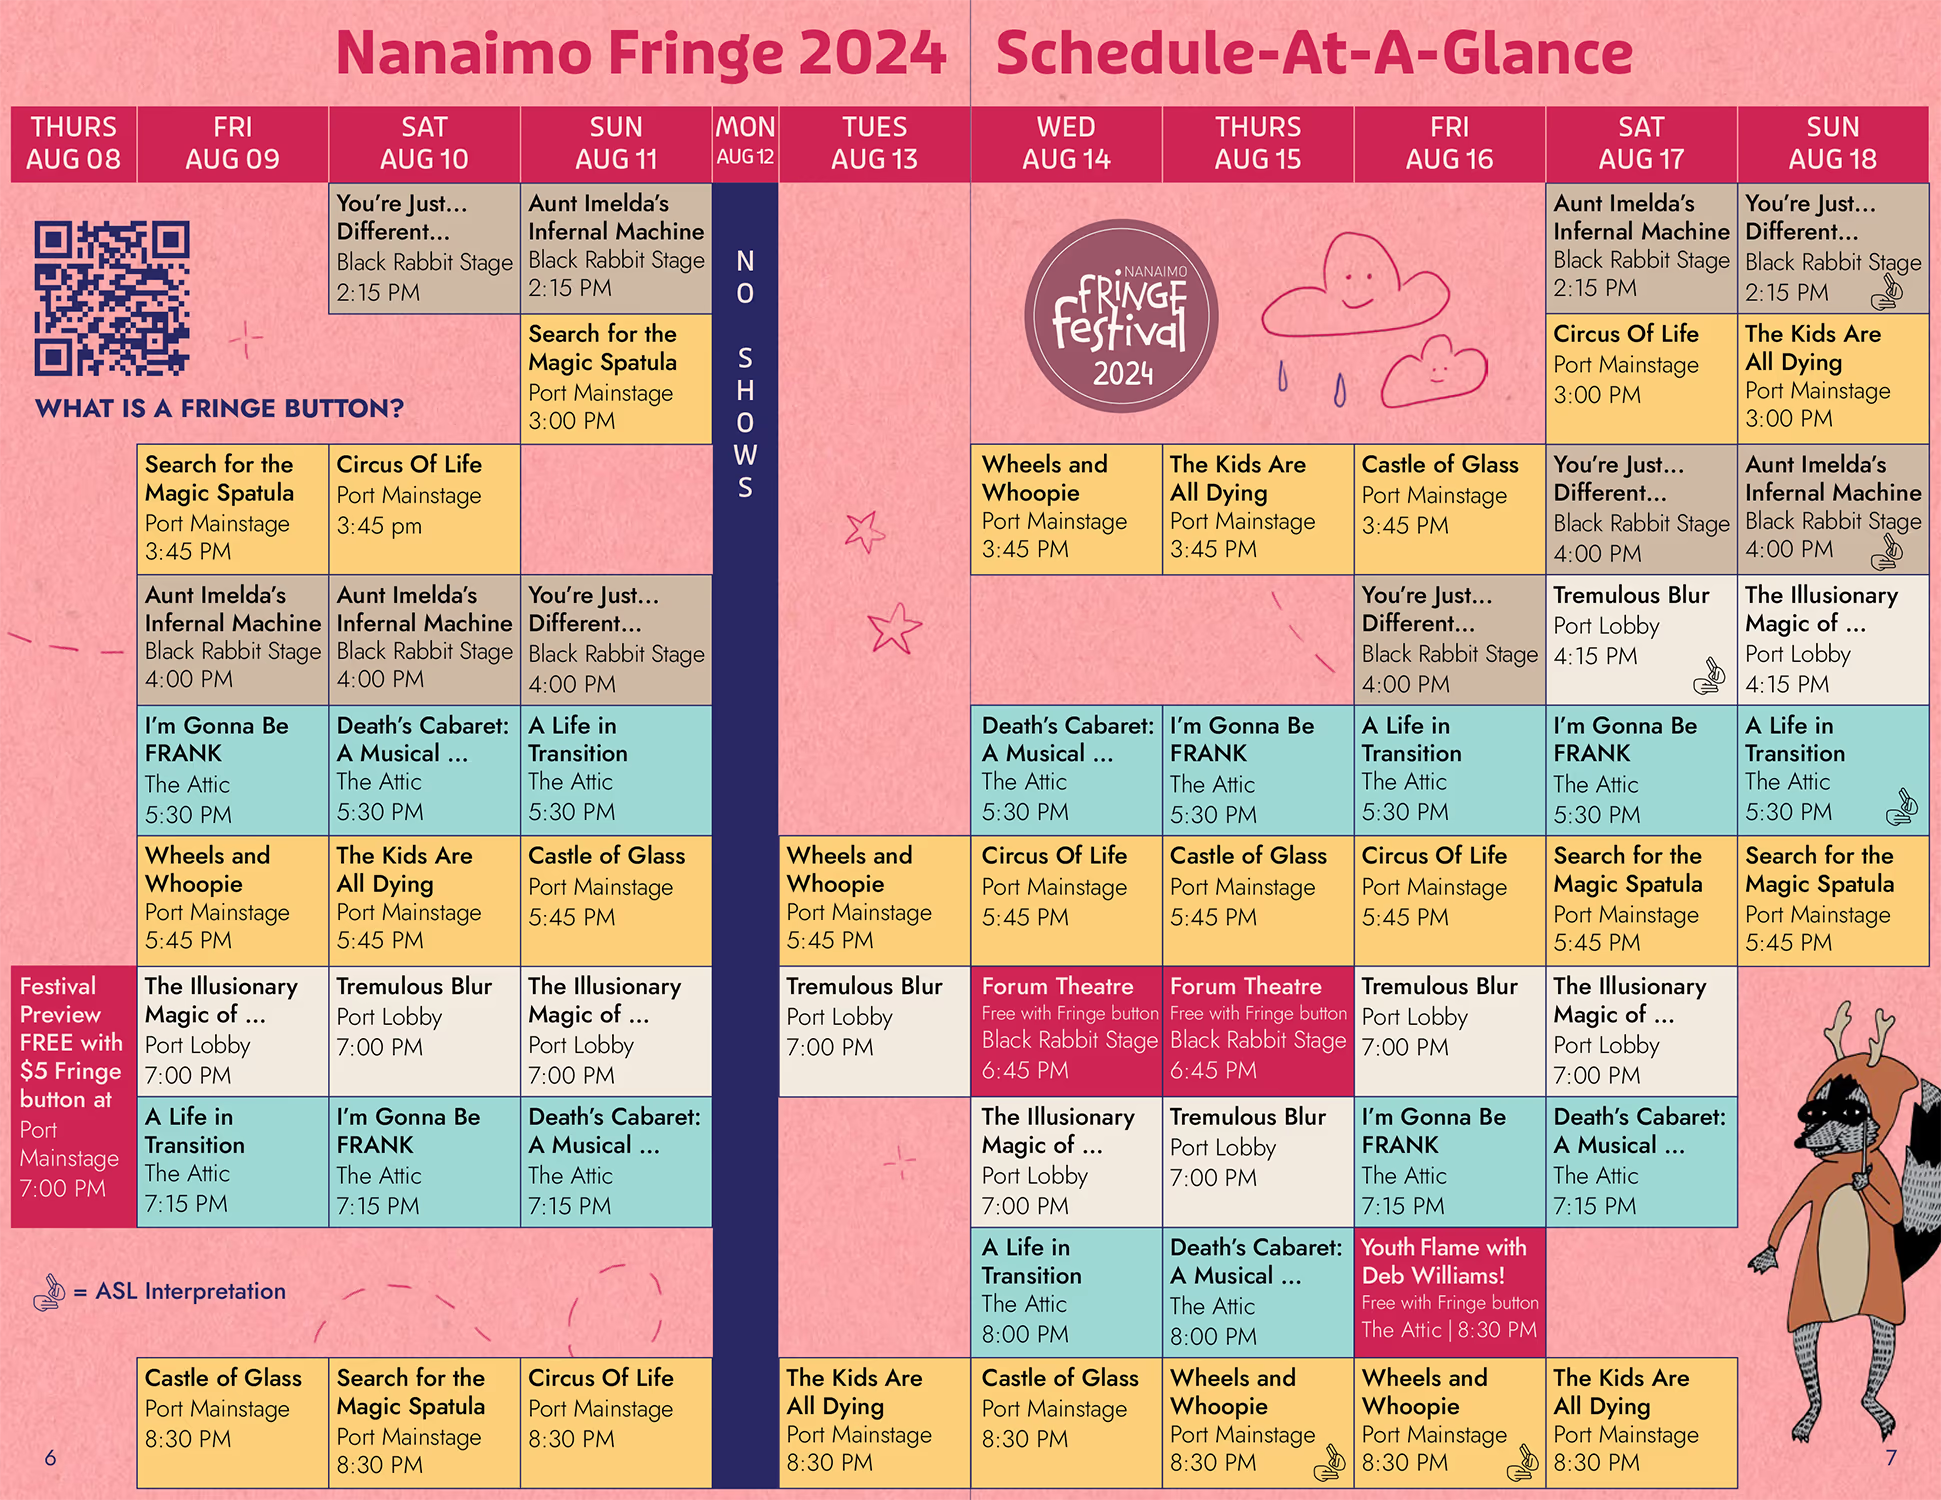
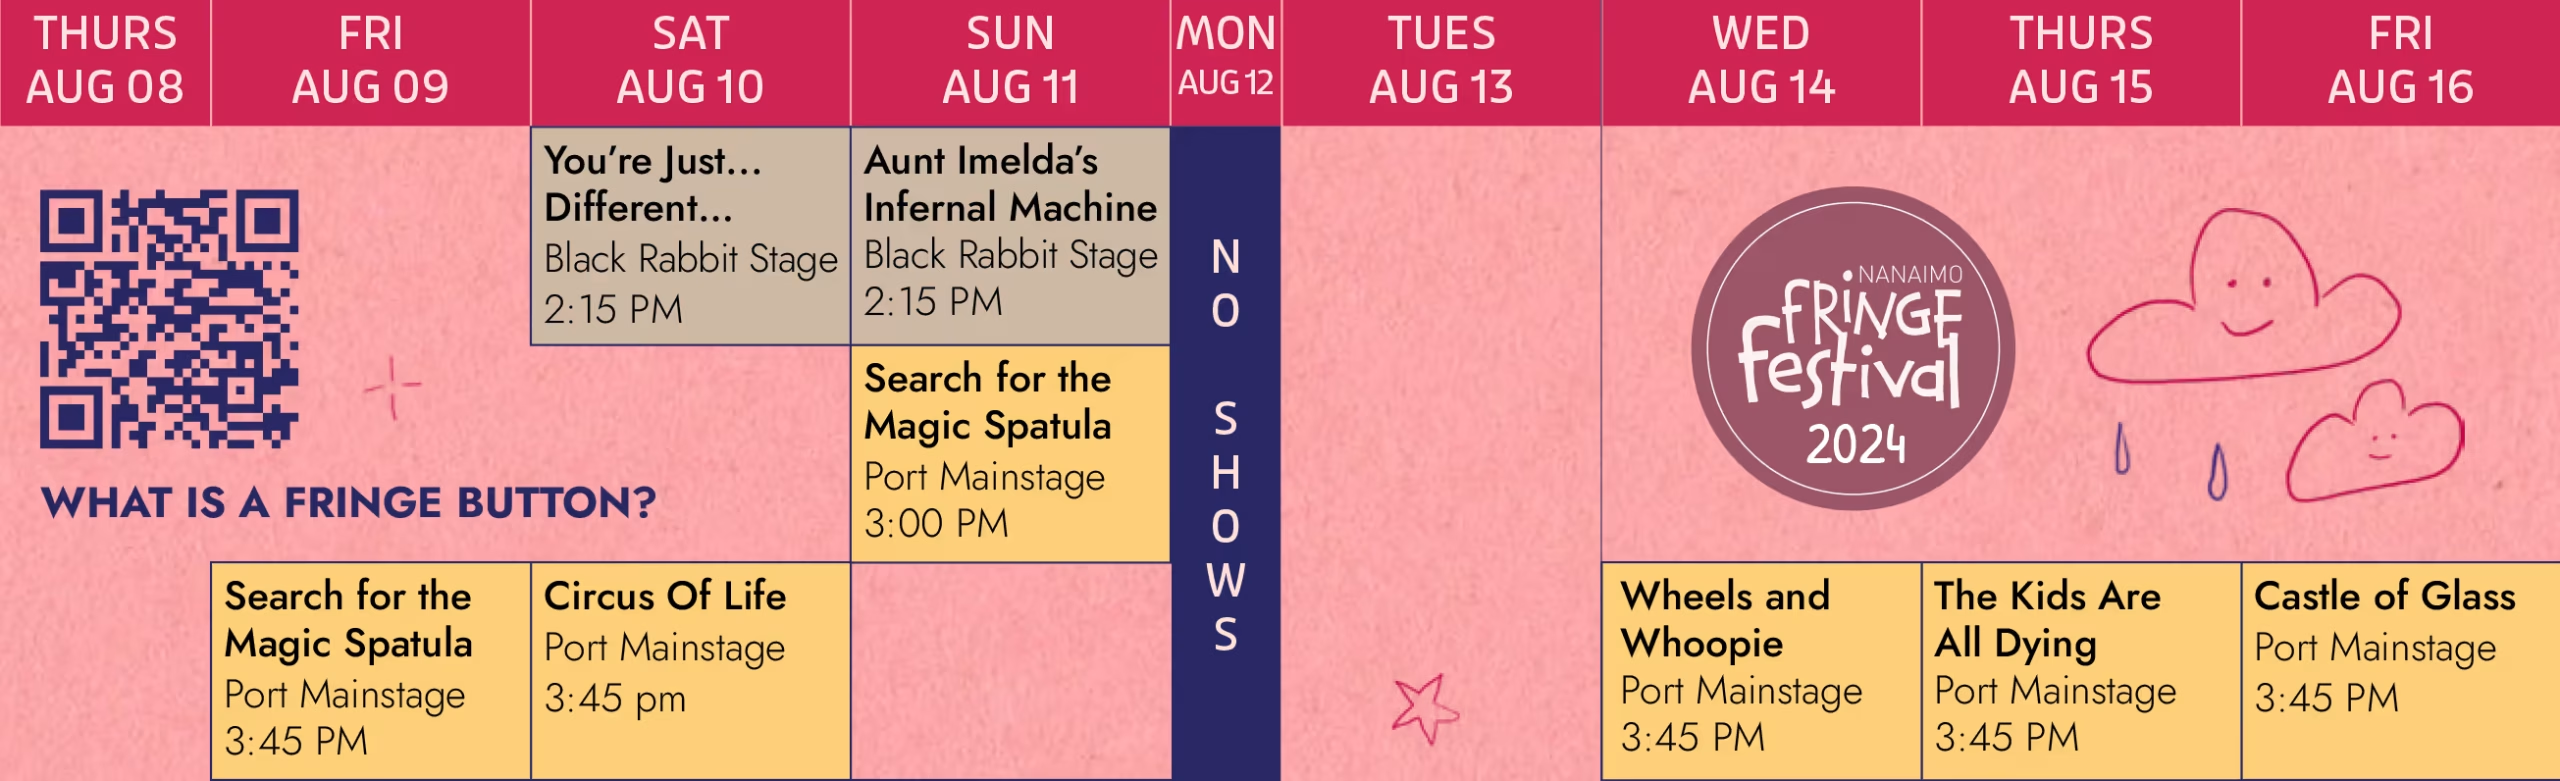
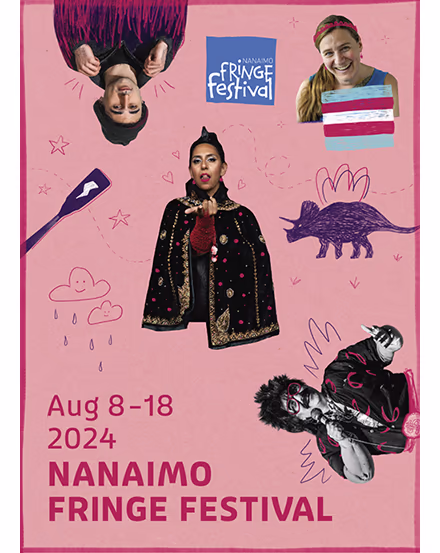
Along with designing the festival’s overall look, I created the timeline for the Nanaimo Fringe Festival 2024 brochure. This schedule outlines numerous performances and events across four venues over ten days. While subtly incorporating the festival’s visual elements, I color-coded the timetable according to the different festival venues. Special events were highlighted in the festival’s bright maroon to make them stand out. I arranged individual performances according to their time slots and made precise layout adjustments to maximize the use of space and enhance readability.
Specializing in information design, I create a wide range of informative graphics, such as maps, infographics, icons, graphs, and report design.